Anatomy of an old infarct
60 year old male presented to the ED with shortness of breath. CT scan of the chest obtained with contrast to evaluate for aortic dissection. He has a known old LAD territory STEMI from 3 years prior, at which time he received LAD stent placement. The old MI is obvious on CT, and I am told, equally obvious on the EKG.
Can we learn something about the old MI from Spectral CT?
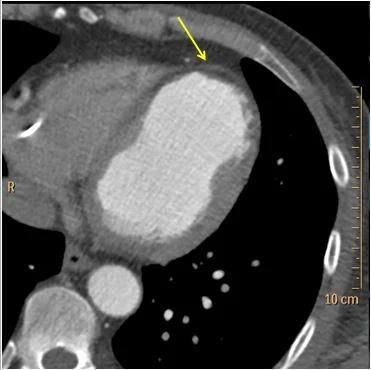
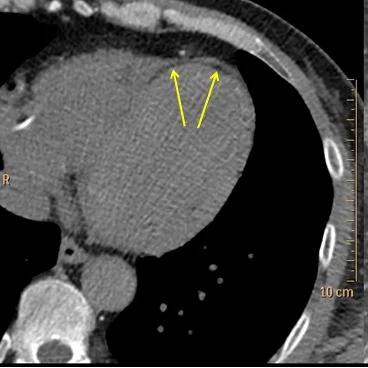
Conventional CT shows wall thinning and apparent hypoenhancement in the distal anterior wall and apex. On spectral images, using the virtual non-contrast image, we can tell there is deposition of fat in the subendocardium (negative HU values). Fat deposition is a common finding in old MI. There is also markedly decreased iodine uptake in the old MI, relative to the normal myocardium.
Spectral curves give us another way of characterizing the old MI: fat has a curve that slopes down to the left, and normal enhancing myocardium has a curve that slopes upwards on the left. Absent iodine uptake in the infarct keeps the curve flat.
Now combine all this information with radiomics, and you have quite a bone to chew!
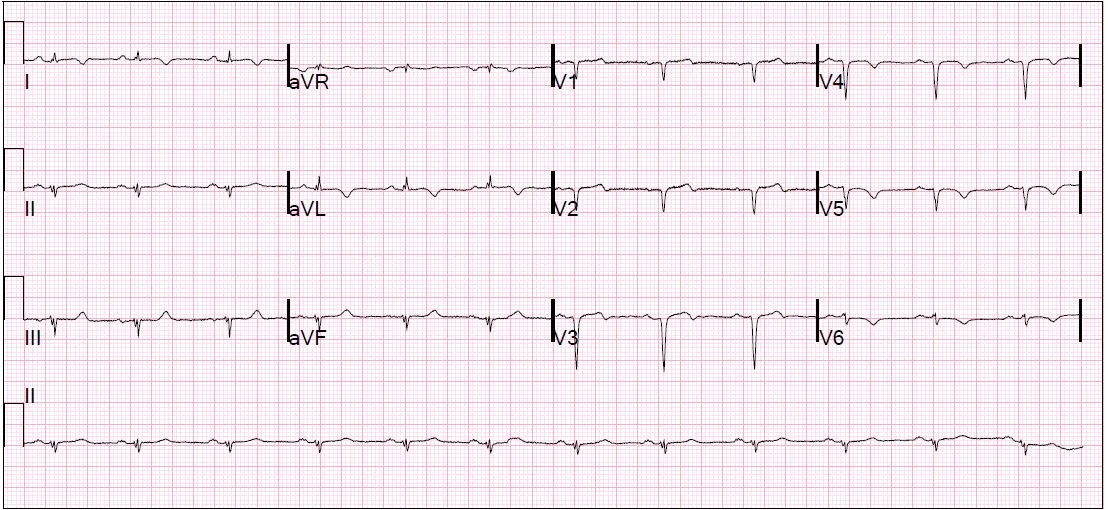
EKG: Read as unchanged from a year prior. No idea what it shows.
Conventional CT: Clear old distal anterior and apical infarct (yellow arrow). Wall is thin and hypoenhancing relative to normal myocardium.
Virtual non-contrast: fat deposition in the subendocardium (yellow arrows).
ROI placed in fat (magenta) has density of -69 HU.
Iodine map: Absent perfusion in the distal anterior wall and apex.
Iodine measurement: Notice striking difference between iodine uptake in normal myocardium (2.5 mg/mL) and old infarct (essentially no iodine uptake). The negative iodine uptake in the fat deposition area is likely an artifact of reconstruction.
Spectral curves: Magenta (subendocardial fat) has a curve that slopes down on the left. The remainder of the infarct (blue) stays flat. Normal myocardium slopes upwards on the left.


